In the dynamic world of financial markets, technical analysis provides traders with powerful tools to anticipate price movements. Among these tools, cross trading patterns stand out as critical signals that have guided countless successful trades. After spending over five years deep in the cryptocurrency markets, I’ve come to recognize that understanding cross patterns—particularly the golden cross and death cross—can significantly enhance your trading strategy.
What is Cross Trading?
Cross trading refers to the practice of identifying and trading based on the crossing of significant moving averages on price charts. These crossovers act as powerful technical indicators that signal potential trend reversals or continuations. The term encompasses several types of crosses, with the most widely recognized being the golden cross and death cross.
The fundamental principle behind cross trading is that when shorter-term moving averages cross above or below longer-term moving averages, they indicate shifts in market momentum that often precede substantial price movements. This makes cross trading especially valuable for both short-term traders and long-term investors across various markets, including cryptocurrencies, stocks, forex, and commodities.
Key Components of Cross Trading
Cross trading analysis typically involves:
- Moving Average Selection: Commonly using combinations of the 50-day and 200-day moving averages
- Timeframe Analysis: Evaluating crosses across multiple timeframes for confirmation
- Volume Assessment: Checking if trading volume confirms the cross signal
- Market Context: Interpreting crosses within the broader market environment
- Supplementary Indicators: Using additional technical tools to strengthen cross signals
Understanding the Golden Cross in Trading
What is a Golden Cross in Trading?
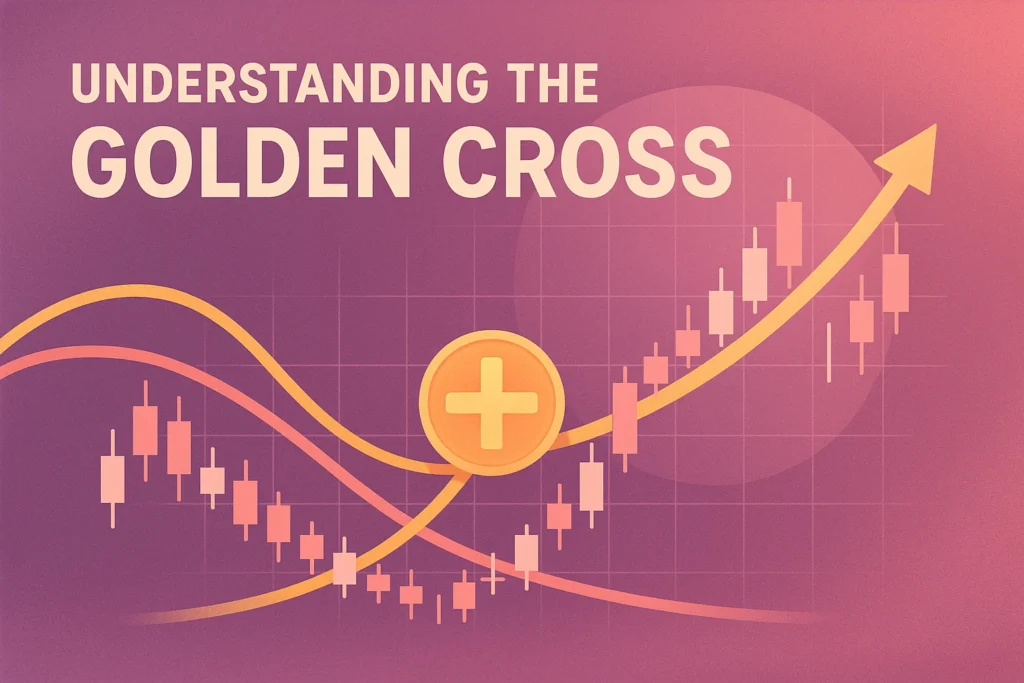
A golden cross is a bullish technical pattern that occurs when a short-term moving average crosses above a long-term moving average. The most widely monitored golden cross involves the 50-day moving average crossing above the 200-day moving average.
Why the Golden Cross Matters
The golden cross is significant because it suggests a potential shift from a bearish to a bullish trend. This crossover indicates that recent price action (represented by the shorter-term moving average) is outpacing the longer-term trend, potentially signaling the beginning of an upward momentum.
Anatomy of a Golden Cross
A complete golden cross formation typically consists of three stages:
- Downtrend Exhaustion: The existing downtrend begins to lose momentum
- The Crossover: The shorter-term MA crosses above the longer-term MA
- Continuation: The cross is followed by a sustained uptrend with both MAs acting as support
Technical Parameters of the Golden Cross
| Component | Typical Setting | Alternative Settings |
|---|---|---|
| Short-term MA | 50-day | 20-day, 30-day |
| Long-term MA | 200-day | 100-day, 150-day |
| Timeframe | Daily | 4-hour, Weekly |
| Volume | Above average | Steadily increasing |
| Confirmation period | 1-3 candles | Up to 7 candles |
How to Trade the Golden Cross Pattern
When a golden cross forms, traders typically consider the following strategies:
- Immediate Entry: Enter long positions shortly after the crossover is confirmed
- Pullback Entry: Wait for a retest of the longer-term MA as support before entering
- Scaled Entry: Take multiple positions as the trend develops
- Options Strategy: Use call options to capitalize on expected upward movement
Key Considerations for Golden Cross Trading
- Market Sector: Golden crosses might have different reliability depending on the market sector or specific cryptocurrency
- Historical Behavior: Check how the particular asset has responded to golden crosses in the past
- Overall Market Conditions: Consider broader market sentiment and macroeconomic factors
- Volatility Assessment: Adjust position sizing based on expected volatility following the cross
What is the Death Cross in Trading?
Understanding the Death Cross
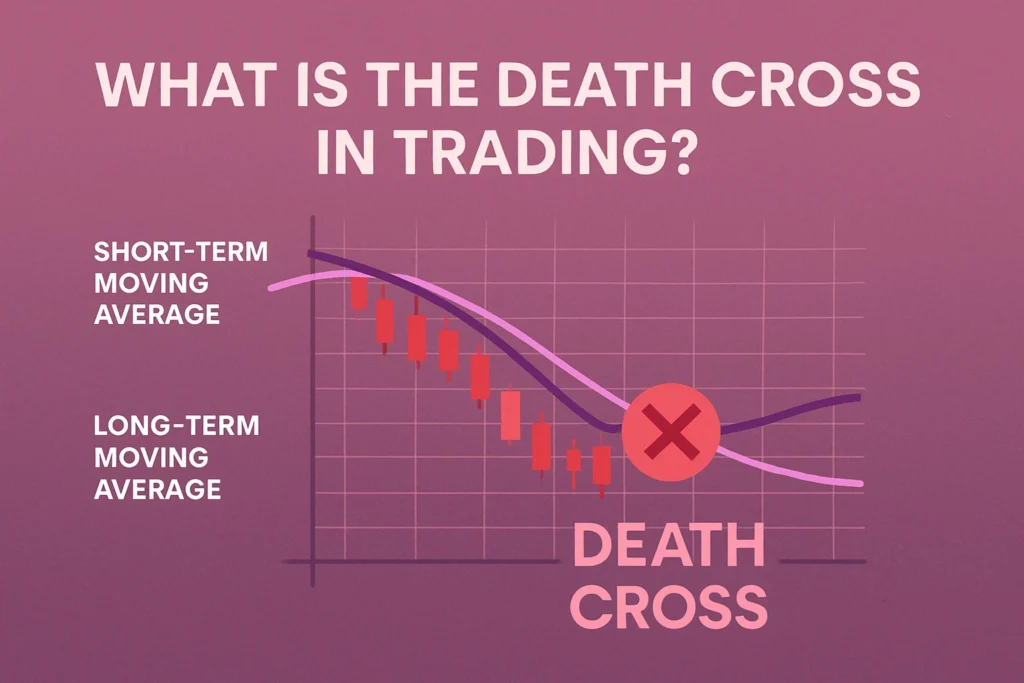
A death cross is a bearish technical pattern that occurs when a short-term moving average crosses below a long-term moving average. Similar to the golden cross, the most commonly observed death cross involves the 50-day moving average crossing below the 200-day moving average.
Significance of the Death Cross in Trading
The death cross signals potential downward momentum and is often viewed as an early warning sign of bearish market conditions. Throughout market history, death crosses have preceded significant market downturns, though they don’t guarantee such movements.
Death Cross Trading Mechanics
The death cross formation typically unfolds through three phases:
- Uptrend Weakening: The existing uptrend shows signs of exhaustion
- The Crossover: The shorter-term MA crosses below the longer-term MA
- Trend Continuation: The bearish trend accelerates with both MAs acting as resistance
Technical Specifications of the Death Cross
| Element | Standard Setting | Alternative Approaches |
|---|---|---|
| Short-term MA | 50-day | 20-day, 30-day |
| Long-term MA | 200-day | 100-day, 150-day |
| Chart timeframe | Daily | 4-hour, Weekly |
| Volume pattern | Increasing on declines | Climactic selling |
| False signal risk | Moderate | Higher in ranging markets |
How to Trade the Death Cross Pattern
When identifying a death cross, traders typically consider these approaches:
- Short Positions: Establishing short positions after cross confirmation
- Existing Position Exit: Closing long positions to preserve capital
- Protective Options: Using put options as downside protection
- Inverse ETFs/Products: Investing in instruments that profit from market declines
Psychological Aspects of Death Cross Trading
Death cross trading requires discipline and emotional control because:
- Market sentiment often turns extremely negative around death crosses
- Media coverage can exacerbate price movements
- False signals can occur, especially in choppy markets
- The pattern sometimes appears after substantial price declines have already occurred
Death Cross in Trading Cryptocurrencies
The cryptocurrency market has shown particular sensitivity to death cross formations due to several factors:
Crypto-Specific Death Cross Characteristics
- Enhanced Volatility: Crypto death crosses often trigger more dramatic price movements
- Market Maturity: Less institutional presence can lead to more technically-driven trading
- 24/7 Trading: Continuous trading means crosses can form at any time
- Leverage Impacts: High leverage in crypto markets can amplify death cross reactions
Historical Impact of Crypto Death Crosses
Bitcoin’s history provides several instructive examples of death cross impacts:
- March 2018: Bitcoin formed a death cross after the 2017 bull run, preceding an 80% drop
- March 2020: A death cross preceded further selling during the COVID-19 market crash
- June 2021: Bitcoin formed a death cross at $30,000, leading to several months of sideways trading
- January 2022: A death cross formed as Bitcoin declined from its all-time high near $69,000
Trading the Crypto Death Cross
When trading the death cross in cryptocurrencies, consider these strategies:
- Stablecoin Rotation: Shifting portions of your portfolio to stablecoins
- Strategic Shorting: Using derivatives to short major cryptocurrencies
- Dollar-Cost Averaging: Using the downturn to accumulate at lower prices
- Cross-Asset Divergence: Looking for crypto assets that don’t follow the broader market pattern
Golden Cross in Trading Cryptocurrency Markets
Cryptocurrency Golden Cross Patterns
The golden cross has historically signaled significant bullish movements in crypto markets:
- April 2019: Bitcoin’s golden cross preceded a move from $5,000 to $14,000
- May 2020: A golden cross formed during Bitcoin’s recovery, preceding a multi-month rally
- September 2021: Ethereum formed a golden cross shortly before reaching its all-time high
- February 2023: Multiple altcoins showing golden crosses preceded substantial sector outperformance
Reliability of Golden Crosses in Crypto
Several factors affect the reliability of golden crosses in cryptocurrency markets:
- Market Cap Influence: More reliable in large-cap cryptocurrencies
- Development Activity: Coins with strong development teams tend to show more reliable signals
- Exchange Listings: New exchange listings can override technical patterns
- Regulatory News: Regulatory developments can overwhelm technical signals
Optimizing Golden Cross Trading in Crypto
To enhance golden cross trading results in cryptocurrency markets:
- Multiple Timeframe Confirmation: Verify crosses on different timeframes
- Volume Analysis: Ensure adequate volume supports the crossover
- Market Sentiment Alignment: Check if social sentiment supports the technical signal
- Fundamental Corroboration: Look for fundamental developments supporting the bullish signal
Advanced Cross Trading Strategies
Cross Trading with Multiple Moving Averages
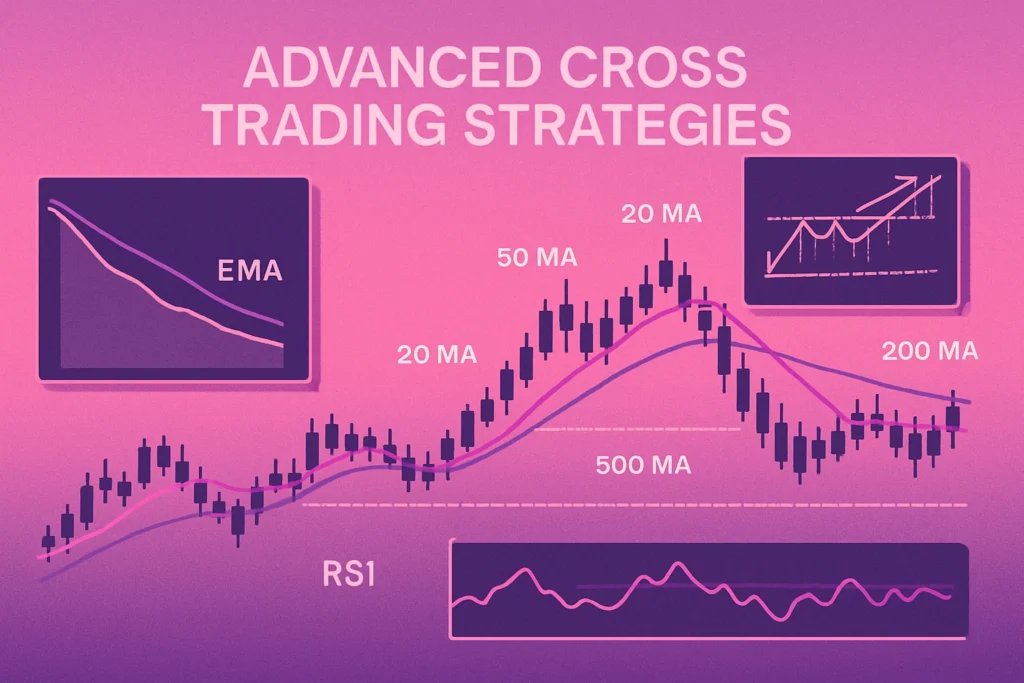
Beyond the standard 50/200 crosses, advanced traders incorporate additional moving averages:
- Triple Cross System: Using 20/50/200 MAs to confirm major trends
- Exponential vs. Simple: Comparing EMA crosses to SMA crosses for stronger signals
- MA Ribbons: Using multiple closely-spaced MAs to identify developing cross patterns early
- Adaptive Moving Averages: Utilizing MAs that adjust to market volatility
Combining Cross Trading with Other Indicators
Cross trading becomes more powerful when combined with complementary indicators:
- RSI Divergence: Looking for divergences between price and RSI during cross formations
- MACD Confirmation: Using MACD histogram shifts to confirm cross signals
- Fibonacci Retracement Levels: Identifying key levels after a cross for entry/exit points
- Volume Profile: Analyzing volume distribution to validate cross patterns
Market Cycle Cross Trading
Adjusting cross trading strategies based on market cycle position:
- Accumulation Phase: Using shorter-term crosses (5/20) to identify early trend changes
- Bull Market: Employing longer-term crosses (50/200) for major position entries
- Distribution Phase: Watching for failed crosses as distribution signals
- Bear Market: Using crosses primarily as exit signals rather than entry points
Sector-Specific Cross Trading
Cross patterns can vary in effectiveness across different cryptocurrency sectors:
| Crypto Sector | Most Effective Cross | Secondary Confirmation |
|---|---|---|
| Layer-1 Platforms | 50/200 EMA | Funding Rate Normalization |
| DeFi Tokens | 20/50 EMA | TVL Growth |
| NFT Projects | 20/100 EMA | Trading Volume Spike |
| Gaming Tokens | 30/100 EMA | User Growth Metrics |
| Privacy Coins | 50/200 SMA | Regulatory News Cycle |
Common Mistakes in Cross Trading
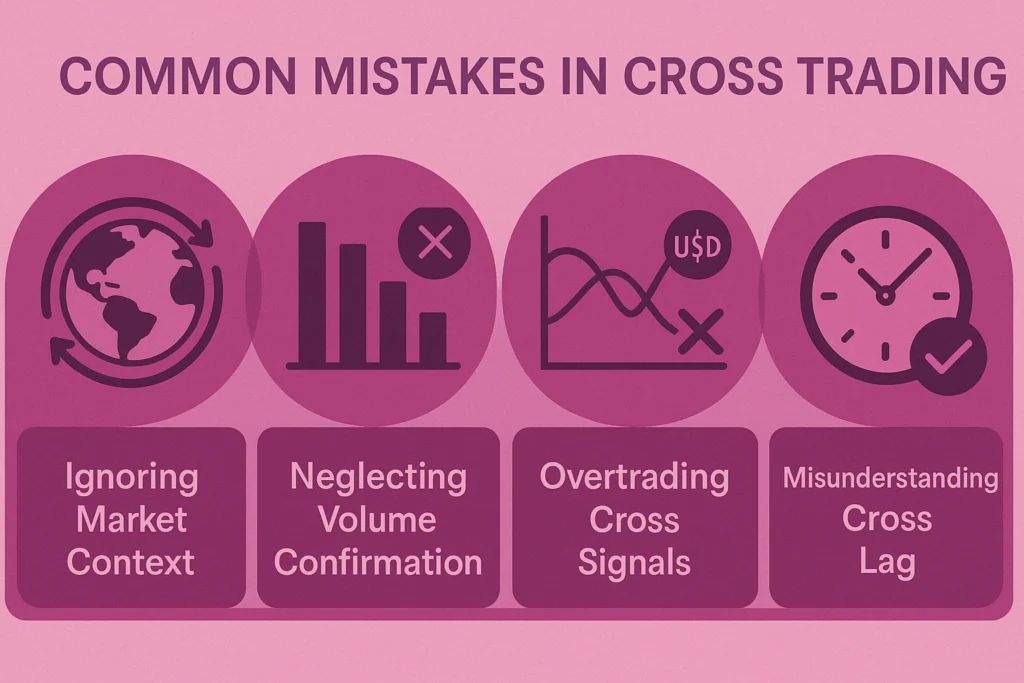
Ignoring Market Context
One of the biggest mistakes is treating cross patterns as isolated signals without considering:
- Broader market trends and sentiment
- Macroeconomic conditions
- Sector-specific developments
- Liquidity conditions
Neglecting Volume Confirmation
Volume provides critical validation for cross patterns:
- Low-volume crosses have higher failure rates
- Volume should increase in the direction of the new trend
- Volume divergence from price action often signals false crosses
Overtrading Cross Signals
Many traders fall into these cross trading traps:
- Trading every cross without filtering for quality
- Using too many cross combinations across multiple timeframes
- Taking full-sized positions on initial cross signals
- Ignoring risk management principles during cross formations
Misunderstanding Cross Lag
The inherent lag in moving averages means:
- Crosses often form after significant price movement has occurred
- Immediate entry after crosses can sometimes be suboptimal
- Shorter-term crosses provide earlier signals but with more noise
- In volatile markets, crosses can whipsaw repeatedly
Optimizing Cross Trading Results
Risk Management in Cross Trading
Effective risk management should include:
- Position Sizing: Adjusting position size based on cross reliability
- Stop Loss Placement: Setting stops at technically relevant levels
- Scaling Strategy: Building positions gradually as the new trend confirms
- Profit Targets: Establishing realistic profit objectives based on historical patterns
Cross Trading in Different Market Conditions
Adapting cross trading approaches based on market conditions:
- Trending Markets: Crosses work best in clearly trending environments
- Sideways Markets: Higher risk of false signals, requiring tighter filters
- Volatile Markets: Consider using longer-term MAs to reduce noise
- Low Volatility: Shorter-term crosses can identify early momentum shifts
Backtesting Cross Trading Strategies
Improve cross trading through systematic backtesting:
- Test across multiple market cycles
- Compare performance across different assets
- Analyze false signal frequency
- Measure average profit factor of confirmed signals
Portfolio Approach to Cross Trading
Rather than trading individual crosses in isolation:
- Apply cross analysis across multiple assets simultaneously
- Look for cross clusters within related sectors
- Balance exposure between assets at different cross stages
- Rotate capital toward the strongest cross setups
FAQ: Cross Trading
What is cross trading in the context of market regulations?
In regulatory terms, cross trading refers to matching buy and sell orders for the same asset across different client accounts without recording the trade on an exchange. This practice is heavily regulated and typically restricted in most markets to prevent conflicts of interest. This is different from the technical analysis cross trading discussed in this article, which refers to trading strategies based on moving average crossovers.
Are golden crosses more reliable than death crosses?
Historical data suggests golden crosses have slightly higher reliability in prolonged bull markets, while death crosses perform better during bear markets. This asymmetry likely results from the generally upward bias of markets over long timeframes. However, both signals must be evaluated within current market conditions rather than relied upon blindly.
How often should I expect to see cross patterns in cryptocurrency markets?
On daily charts using the standard 50/200 MA combination, major cryptocurrencies typically form 1-3 significant crosses per year. However, the frequency increases substantially on lower timeframes or when using shorter-period moving averages. Quality matters more than quantity—focus on well-formed crosses with strong confirmation signals.
Can cross patterns be used for short-term day trading?
Yes, by using shorter-period moving averages (such as 5/20), cross patterns can be effectively applied to intraday trading timeframes. However, these shorter-term crosses generate many more signals with lower reliability, requiring additional confirmation filters and stricter risk management.
How should cross trading strategies adapt during extreme market conditions?
During extreme volatility or black swan events, moving averages can lag significantly behind rapid price movements. In these conditions, consider:
- Temporarily reducing position sizes
- Focusing on higher timeframe crosses only
- Requiring stronger confirmation from other indicators
- Being prepared for false signals and whipsaws
Cross Trading: Building Your Strategy
Creating an effective cross trading strategy requires balancing technical signals with market context. Here’s a framework for developing your approach:
Foundational Components
- Define Your Cross Parameters: Select appropriate moving averages based on your trading timeframe and risk tolerance
- Establish Confirmation Criteria: Determine what additional factors must confirm a cross signal
- Develop Entry Rules: Create specific rules for trade entry following crosses
- Set Risk Parameters: Define position sizing and stop-loss placement rules
- Plan Exit Strategies: Establish both profit targets and technical exit signals
Implementation Process
To implement your cross trading strategy:
- Start with Paper Trading: Test your approach without real capital at risk
- Maintain a Trading Journal: Record all cross signals and outcomes
- Perform Regular Reviews: Analyze performance and refine parameters
- Scale Gradually: Increase position sizes as your system proves reliable
- Adapt to Market Evolution: Be willing to adjust your approach as market conditions change
Cross Trading Technology Tools
Consider these tools to enhance your cross trading:
- Automated Alerting Systems: For cross formations across multiple assets
- Backtesting Software: To validate strategies across historical data
- Portfolio Management Tools: For tracking position sizing and risk
- Market Sentiment Analysis: To provide context for technical signals
Developing Your Cross Trading Edge
Successful cross traders develop these advanced capabilities:
- Pattern Recognition: Identifying high-probability cross formations
- Context Sensitivity: Understanding when crosses matter most
- Patience: Waiting for quality setups rather than forcing trades
- Discipline: Following your system even when emotions suggest otherwise
- Continuous Learning: Studying both successful and failed signals
Conclusion: Mastering Cross Trading
Cross trading provides a powerful framework for identifying potential trend changes across all financial markets, including cryptocurrencies. By understanding both golden cross and death cross patterns—along with their limitations—traders can develop more effective strategies for capital preservation and growth.
Remember that crosses are lagging indicators by nature, meaning they confirm trends rather than predict them. The most successful cross traders use these patterns as part of a comprehensive trading approach that includes multiple forms of analysis and rigorous risk management.
Whether you’re a seasoned trader or relatively new to technical analysis, incorporating cross trading concepts into your strategy can help you identify significant market turning points and make more informed trading decisions. Start by focusing on the highest-probability setups with strong confirmation signals, and gradually refine your approach as you gain experience.
With practice and consistency, cross trading can become a valuable addition to your trading toolkit, helping you navigate the volatile cryptocurrency markets with greater confidence and potentially improved results.
Adam Fent is a forex trader who has been involved in the markets since he was a teenager. He started out by day trading penny stocks, and eventually transitioned to Forex because of its liquidity and 24-hour nature.
He has been consistently profitable for the past several years, and is always looking to improve his trading skills. When he's not trading, he enjoys spending time with his wife and two young children.
Related Posts

Will Cryptocurrency Replace Fiat Money? From Paper Notes to Digital Assets
The question is no longer if money is changing—it's how…

Trading Scalping | Strategy | Definition and PDF
Scalping is a type of trading in which the profit…

The best crypto for staking
Looking to invest in the world of cryptocurrencies? There are…